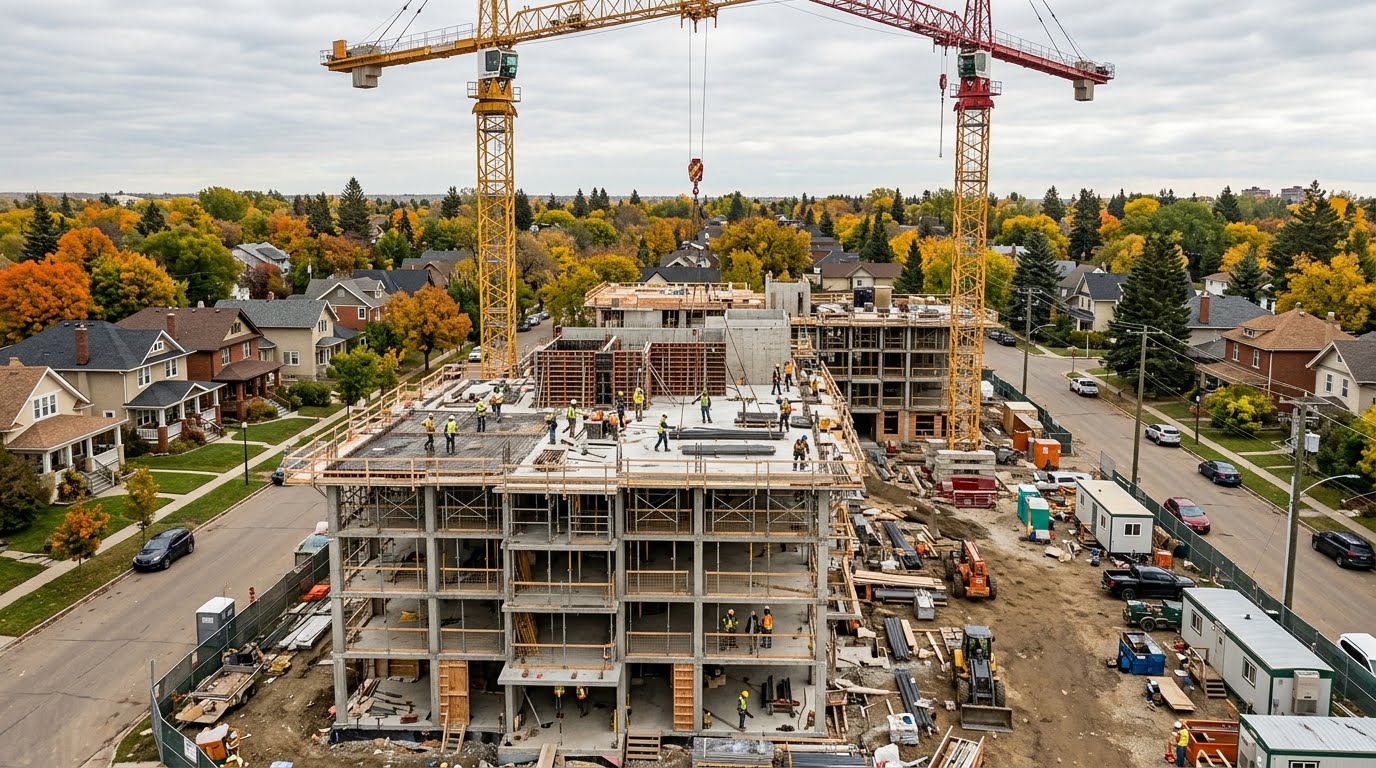
Canada’s construction pipeline strengthened in August 2026, with the total value of building permits rising 8.8% to $13.6 billion.
The increase was driven almost entirely by residential construction intentions, particularly apartment buildings and other multi-unit housing.
Alberta recorded an even larger monthly increase of 21.7%. At the city level, Calgary’s permit values rose 27.1%, while Edmonton increased 19.2%.
But a building permit is not a completed home. Understanding what these numbers measure is essential for anyone trying to assess Canada’s housing shortage, future rental supply or construction activity.
What did Statistics Canada report?
On October 14, Statistics Canada released its August 2026 building permits report.
Total permit values increased by approximately $1.1 billion from July to August, reaching $13.6 billion.
The figures are seasonally adjusted and generally expressed in current dollars unless otherwise indicated.
| Indicator | August 2026 result |
|---|---|
| Canada: total building permit value | $13.6 billion |
| National monthly change | +8.8% |
| Alberta monthly change | +21.7% |
| Residential permit value | $8.5 billion |
| Multi-unit residential permits | $5.8 billion |
| Non-residential permits | $5.1 billion |
Statistics Canada also reported an 8.6% monthly increase when values were adjusted to constant 2023 dollars.
That distinction matters because construction-cost inflation can increase the dollar value of permits even when the underlying volume of activity changes less.
Apartment and multi-unit housing drove the increase
Residential permit values increased by approximately $1.1 billion to $8.5 billion during August.
The growth came from multi-unit residential construction, which increased by approximately $1.1 billion to $5.8 billion.
Multi-unit construction includes several housing types, such as apartment buildings, condominiums, townhouses and semi-detached developments.
Single-family construction intentions were virtually unchanged, edging down by about $0.7 million to $2.6 billion.
That means Canada’s stronger overall residential permit result was not driven by a broad rise in detached-home permitting.
What share of residential permits came from multi-unit housing?
Using Statistics Canada’s rounded August values, multi-unit construction accounted for approximately 69% of the value of residential building permits.
The calculation is:
$5.8 billion ÷ $8.5 billion × 100 = approximately 68.2%
Using the more detailed published values of $5.841 billion and approximately $8.469 billion gives a result close to 69%.
This is a share of the permit value, not the percentage of all Canadian households living in apartments or the share of homes actually completed that month.
Alberta building permits rose 21.7%
Alberta’s total building permit value increased by 21.7% in August, reaching approximately $2.0 billion.
Several types of construction contributed to the change.
Statistics Canada reported that Alberta’s multi-unit residential permit value increased by $115.9 million.
Meanwhile, single-family residential permitting declined by $32.7 million.
Industrial permits also strengthened, with Alberta recording a $169.3 million increase.
Commercial permit values increased by $95.4 million, partially offsetting weaker commercial construction intentions elsewhere in Canada.
These figures show that Alberta’s increase was not confined to one housing category.
Calgary and Edmonton both recorded stronger permit values
Statistics Canada’s metropolitan-area table provides a closer look at the two largest Alberta cities.
| City | July 2026 | August 2026 | Monthly change |
|---|---|---|---|
| Calgary | $776.3 million | $986.9 million | +27.1% |
| Edmonton | $509.4 million | $607.1 million | +19.2% |
Calgary’s building permit values increased by approximately $210.6 million between July and August.
Edmonton’s increased by approximately $97.7 million.
The amounts above include residential and non-residential building permits in each census metropolitan area.
Does Calgary’s larger increase mean its housing market is stronger?
Not necessarily.
A higher total permit value can reflect differences in project size, construction type and the timing of major approvals.
One large apartment or industrial development can have a meaningful effect on monthly permit statistics.
Calgary and Edmonton also have different construction pipelines and local housing conditions.
For that reason, the figures should not be used alone to rank the financial health of either city’s property market.
What do permit values look like over a year?
Compared with August 2025, Calgary’s total building permit value increased by 45.8%.
Edmonton’s increased by 20.5%.
Year-over-year comparisons can help reduce some of the attention placed on one month’s volatility.
However, a building permit is still a measure of construction intentions rather than completed or occupied housing.
Permits, housing starts and completions are different statistics
This is an important distinction for anyone following housing affordability.
| Metric | What it measures |
|---|---|
| Building permits | Construction projects authorized by the relevant authority, reflecting intended construction. |
| Housing starts | Projects where physical construction of a housing unit has begun. |
| Housing completions | Housing units whose construction has been completed under the applicable statistical definition. |
| Rental listings | Properties currently advertised to prospective tenants. |
A project can receive its permit and still take considerable time to begin construction.
Construction can also be delayed by financing, labour availability, contractor scheduling or market conditions.
Even after a project starts, completed homes may take months or years to become available.
Maple Curiosity’s August 2026 Housing Starts analysis examines a different stage of the construction process.
How many homes were authorized in August?
Statistics Canada reported approximately 21,800 multi-unit dwellings and 4,000 single-family dwellings authorized across Canada in August.
That is about 25,800 authorized dwellings in total.
The number was 12.8% higher than in the previous month.
However, the longer-term picture is less straightforward.
The 12-month total was actually lower than a year earlier
Over the 12 months from September 2025 through August 2026, Canadian authorities issued permits for approximately 299,500 residential dwelling units.
That compares with 305,500 in the previous 12-month period.
The difference is approximately 6,000 units, or a decline of about 2%.
This illustrates why one strong monthly report does not automatically mean Canada’s longer-term housing shortage is being resolved.
Does more apartment permitting mean rents will fall?
More apartment development can eventually improve rental supply.
But an increase in permits does not guarantee lower rent in the near term.
Rental prices depend on several factors, including how quickly new units become available, household formation, immigration, vacancy rates and what renters can afford.
New apartment buildings can also enter the market at relatively high asking rents because development and financing costs are substantial.
Maple Curiosity’s Canada Rental Construction analysis explains why a larger rental construction pipeline can coexist with expensive newly built apartments.
Alberta’s infill zoning dispute adds another layer
Edmonton is also facing regulatory changes to how new housing can be built in established neighbourhoods.
Alberta recently directed the city to roll back important parts of its infill zoning framework.
Those changes concern local land-use rules, housing density, building heights and parking requirements.
The provincial direction does not automatically invalidate every previously issued permit or determine the outcome of every future application.
Maple Curiosity’s Edmonton Infill Zoning guide explains that separate issue.
Non-residential permits tell a different story
Outside residential construction, total non-residential building permits edged down by approximately $29.8 million to $5.1 billion in August.
But the components moved in different directions.
| Construction type | August permit value | Monthly change |
|---|---|---|
| Industrial | $1.1 billion | +39.1% |
| Commercial | $2.2 billion | -14.8% |
| Institutional | $1.8 billion | +1.9% |
Alberta made an important contribution to the national increase in industrial permits.
Industrial facilities can support manufacturing, processing, logistics and other commercial activity, but their building permit values should not be confused with future confirmed employment.
What should homebuyers and renters watch next?
For prospective buyers and renters, a single building permit report is not enough to predict the direction of prices.
More useful indicators include:
- housing starts and completions over several months
- new rental listings and vacancy rates
- mortgage rates and financing conditions
- household income and employment trends
- construction costs and whether developers continue advancing projects
For a prospective renter in Alberta, it is also useful to compare actual available units rather than assuming stronger construction intentions will immediately produce cheaper apartments.
A simple way to interpret the next permit report
When Statistics Canada publishes the next monthly release, readers can use a short three-step check.
- Compare total permits: did the increase continue, or was August unusually strong?
- Separate housing types: did multi-unit projects continue growing while detached-home construction remained weak?
- Look at construction outcomes: are the additional permits being followed by housing starts and, eventually, completed homes?
These comparisons provide more insight than simply looking at whether the latest headline number is positive or negative.
When will the next building permits report be released?
Statistics Canada has scheduled its September 2026 building permits release for November 12, 2026.
That report will provide another opportunity to see whether August’s increase was part of a sustained trend or a particularly strong month for new project approvals.
What the August numbers actually tell us
August brought a clear improvement in Canadian construction intentions, particularly multi-unit residential development.
Alberta stood out with a 21.7% increase, supported by stronger residential, industrial and commercial permitting. Calgary and Edmonton both recorded sizeable monthly gains.
But the most useful conclusion is not that Canada’s housing shortage is over.
The figures show more authorized investment in potential construction. Whether that becomes more completed housing, improved rental availability or lower costs will depend on what happens after the permits are issued.
Leave a Reply